Attack charts
The attack charts section is a premium feature that lets you review the results of your attacks.
Opening the Attack charts side menu shows a simplified panel with 4 menu items:
- Daily detail
- Monthly detail
- User detail
- History
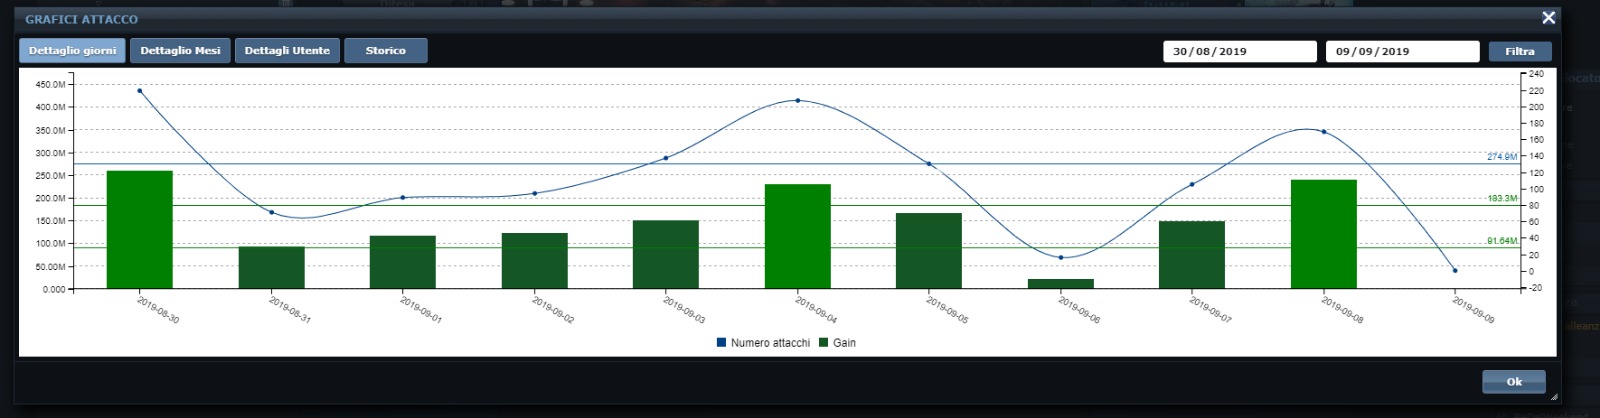
Daily detail has a time filter: the chart shows the data for the selected interval. Clicking the bar of a specific date opens the details for that day, hour by hour.
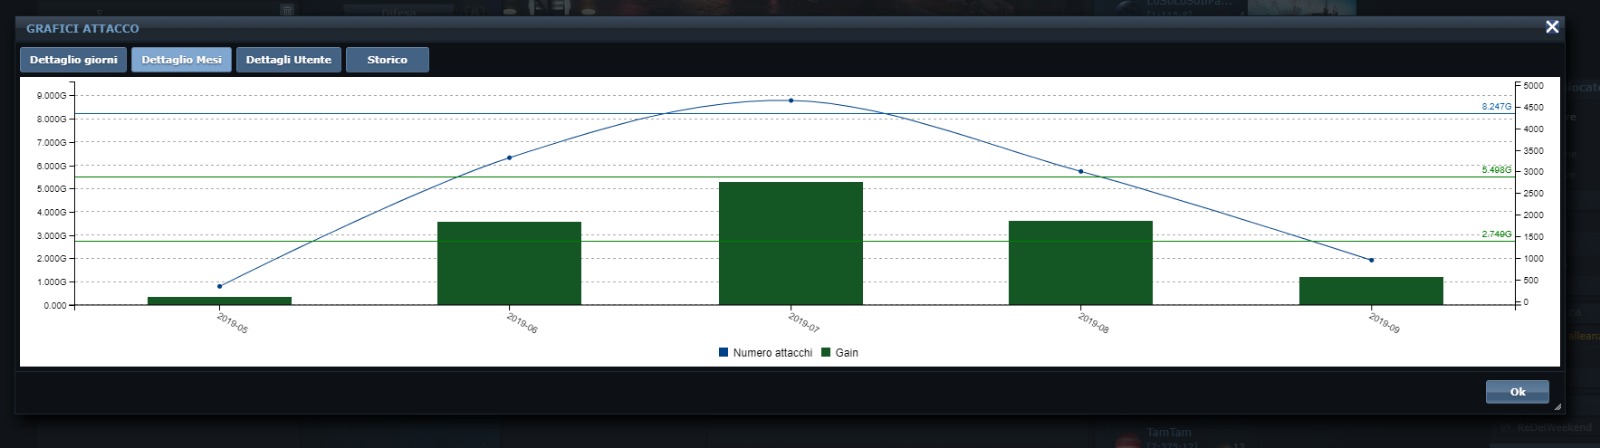
Monthly detail shows a monthly chart; clicking a month goes back to the daily chart, filtered on the chosen month.
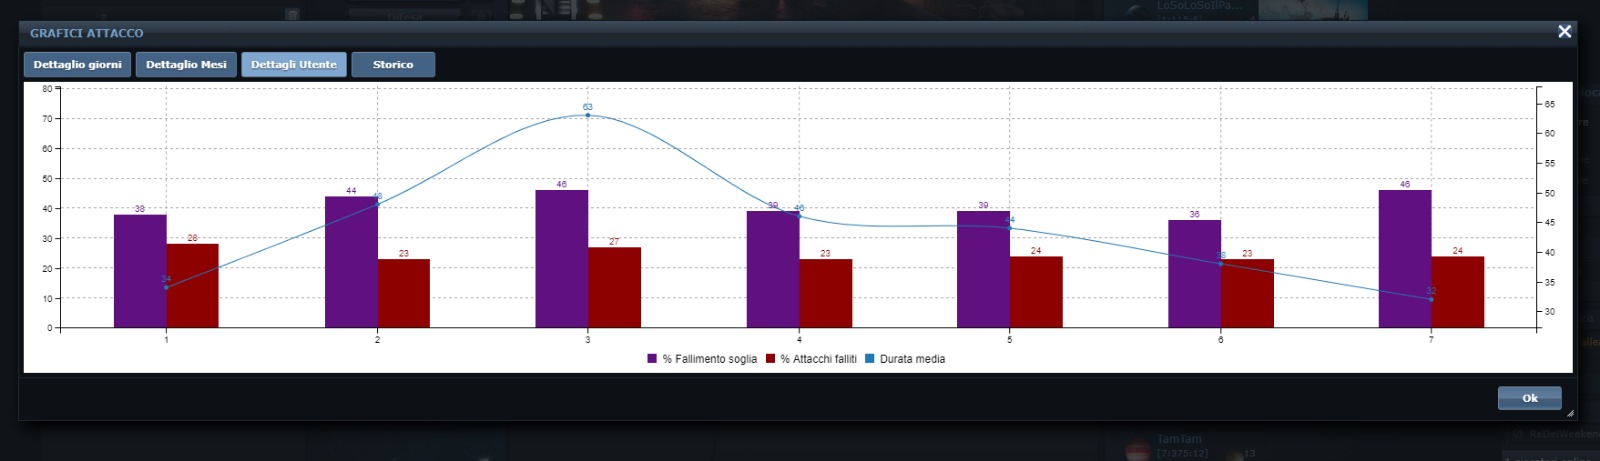
User detail reads the parameters set in the attack panel and charts 3 indicators:
- Threshold failure: the average percentage by which an attack falls short of the threshold (e.g. with a 900k threshold, an attack that looted 450k has a 50% threshold failure);
- Failed attacks: an attack is considered failed when it does not meet the threshold it was launched for (set in the attack panel);
- Average duration: the average one-way duration of the attacks.
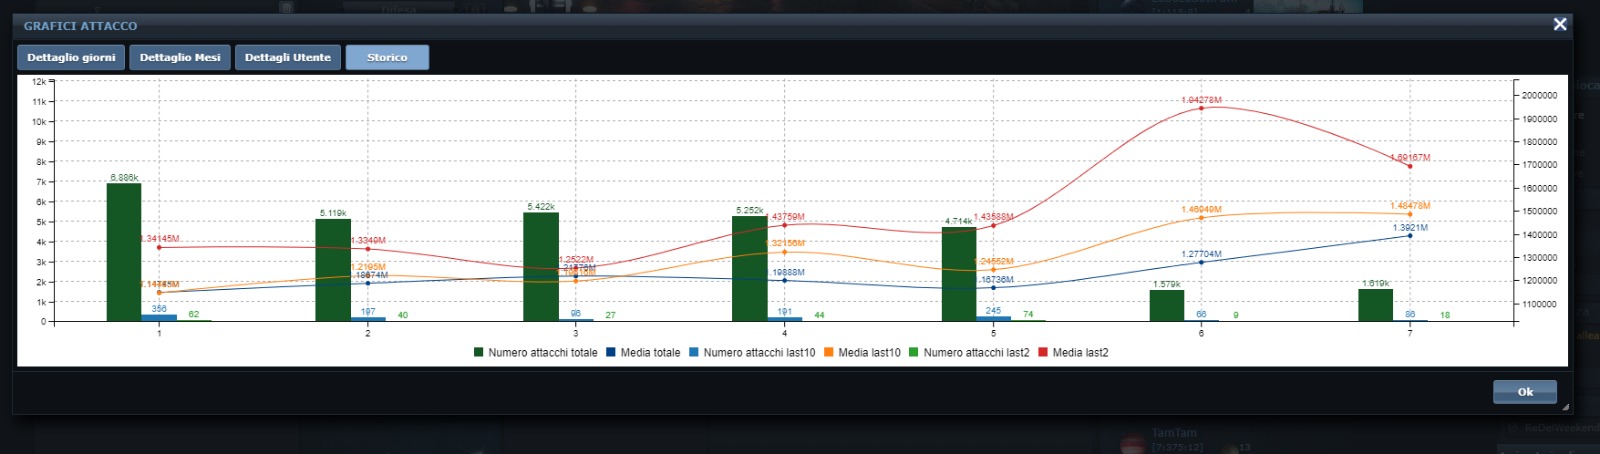
History shows the attack trend over time, comparing the full history, the last 10 days and the last 2 days.